
Last updated:
The most useful golf club distance chart records your own typical carry and spread, with total distance kept separate. Do not build a playing plan from another golfer’s best shot or an average table that hides the ball, conditions and measurement method. Use a repeatable gapping session, label the results clearly and update the chart when your equipment or normal flight changes. The worksheet structure below shows what to record without inventing distances for you.
Link disclosure: The manufacturer and retailer links in this guide are direct links. They are included to help you check the named products and do not use affiliate tracking.
Guide checked: 8 September 2026. This guide compares the linked manufacturer and retailer information. We have not carried out hands-on product testing. Check the exact specification and current offer before buying.
| Field | What to enter | Why it matters |
|---|---|---|
| Club and specification | Model, loft and relevant setting | Identifies what produced the shots |
| Typical carry | Median or another clearly labelled summary | Keeps the main number distinct from the longest ball |
| Carry spread | Observed range of the chosen shot sample | Shows ordinary variation |
| Total distance | Record separately if reliably measured | Includes ground travel |
| Conditions and date | Ball, surface, weather and device mode | Makes later comparisons interpretable |
Table of Contents
A coached gapping session
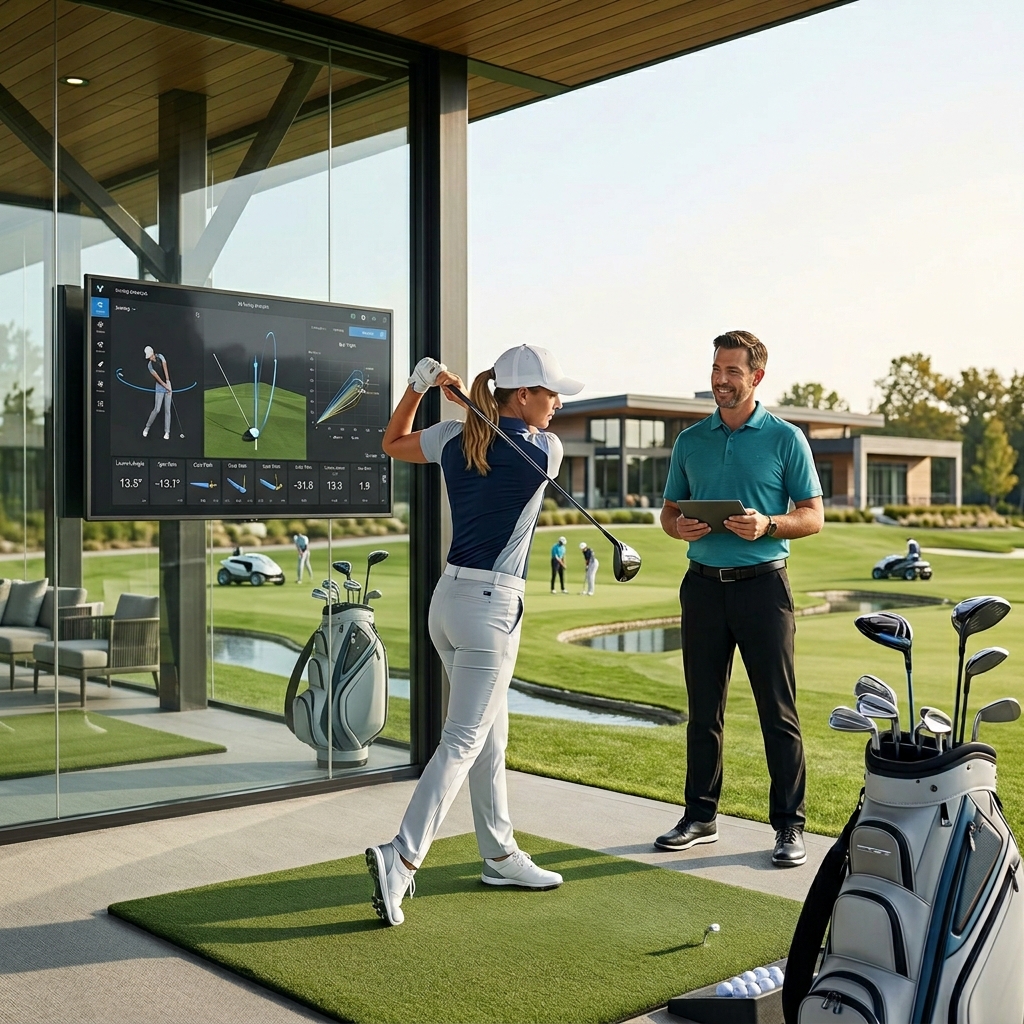
Use the PGA Play finder to locate a professional and ask whether a gapping session with appropriate measurement is available. Confirm the session scope, equipment and what record you will receive.
A lesson listing does not automatically include launch-monitor time or a distance report, so establish those details when booking.
Garmin Approach R10: a measurement option to assess
The R10 is a portable radar launch monitor. Before buying, check its full setup requirements, compatible device and the space available at your practice location.
A personal device can support repeated sessions, but it is not necessary to buy one simply to create a first chart. A suitable existing facility may meet that need.
Separate carry from the ball’s final position
Trackman defines its carry measure using where the trajectory returns to the same height as the starting point. Check the definition used by your device or facility, especially if conditions or normalisation settings are involved. Do not silently combine different metrics in one column.
On the course, the ball’s final position can include bounce and roll. A GPS shot-distance record can therefore be useful without being a direct measurement of airborne carry. Keep that distinction clear when planning a shot that must cross a hazard.
Collect a representative sample
Use the same ball type where practical and warm up before recording. Hit normal swings with each club rather than trying to establish a maximum. Keep the intended shot type clear: a full swing and a controlled partial wedge should have separate entries.
Agree how obvious measurement failures will be handled, and retain ordinary mishits rather than deleting every short result. Record the sample size. A chart based on only the best strikes can encourage a club choice that depends on contact you do not routinely produce.
Use a labelled summary
Here is an arithmetic example, not a benchmark for any club: seven recorded carries of 145, 147, 148, 149, 150, 151 and 153 yards have a median of 149 yards and an observed range of 145–153. The median is the middle value after sorting.
The printable carry-distance worksheet gives you a blank table for your own measurements and a smaller summary for your bag. Pair that record with our GPS versus rangefinder guide when deciding how to measure the shot in front of you.
That example explains how to summarise a sample without calling its longest result the stock distance. It is not a guaranteed future range or a statistical confidence interval. Your own chart should state what its number means and retain the underlying observations where possible.
Build the chart around the clubs you use
Create one row for each relevant club and shot type. Add the actual loft or setting when useful, particularly around hybrids, fairways and wedges. The number printed on a club is not enough to compare two different iron models.
Look for overlapping usable distances and large gaps. A new club is not automatically needed whenever two medians are close; their flight, lies and intended jobs can differ. Discuss a persistent gap with a fitter before changing the bag from arithmetic alone.
Record conditions rather than hiding them
Note the date, ball, location and measurement mode. If the facility applies a normalised result, label it rather than mixing it with unadjusted outdoor shots. Different range balls, wind or surfaces can make two sessions difficult to compare directly.
Keep the chart simple enough to use. A main reference for ordinary conditions can sit alongside brief notes for meaningful variations. Do not pretend that a precise-looking number removes the need to judge the lie, target, wind and landing area during play.
Use the chart as a decision aid
Consider the consequence of finishing short or long, not just whether the target matches the median. A forced carry deserves attention to your ordinary variation and the actual conditions. Avoid choosing a club on the assumption that your best recorded carry will appear on demand.
Recheck distances after a material equipment change or when repeated play suggests the old chart no longer describes your shots. Save the previous version with its date so the change is understandable. The value lies in a realistic record you maintain, not a universal distance table.
Our club fitting guide explains how to turn identified distance gaps into a focused equipment comparison.